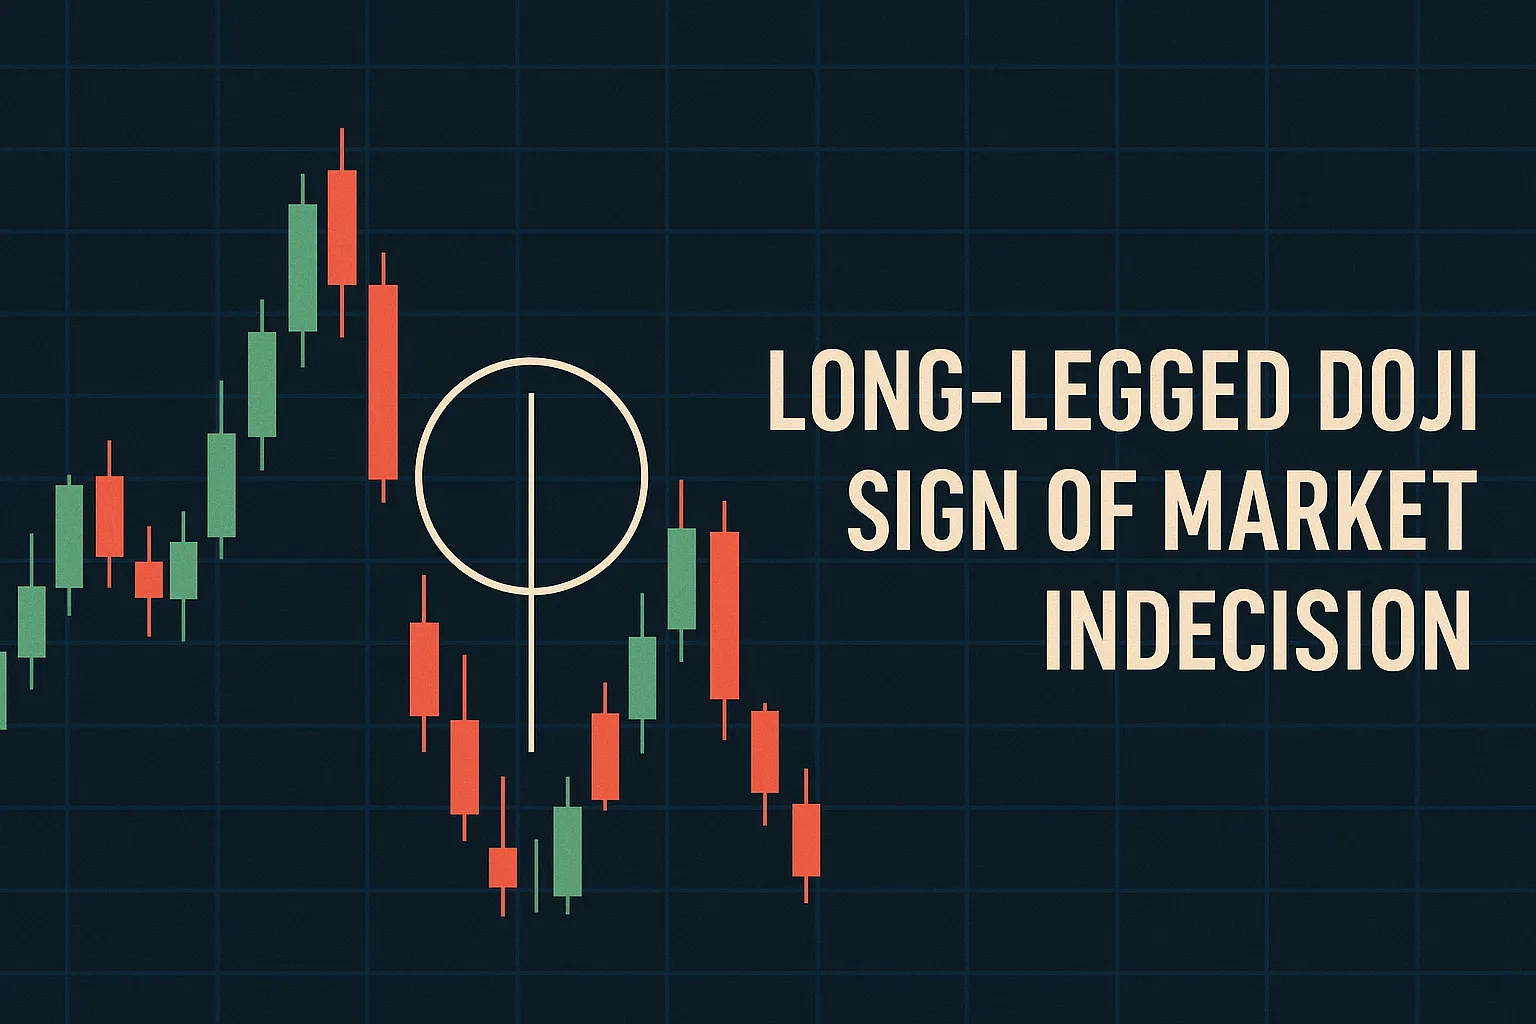
Introduction Long-Legged Doji Market Indecision
The Long-Legged Doji is a unique candlestick pattern that represents extreme indecision in the market. With long wicks on both ends and little to no body, it shows that both buyers and sellers tried to control the market, but neither succeeded. Understanding this pattern helps traders anticipate strong moves that may follow once indecision is resolved.
What is a Long-Legged Doji?
- Appearance: Long upper and lower shadows, with the open and close at or near the midpoint.
- Psychology: The market swung widely in both directions but ended up at nearly the same price.
- Signal: Indicates a pause and uncertainty; often followed by a breakout or trend continuation.
Where and When to Spot It
- Can appear anywhere in a trend—at tops, bottoms, or within ranges.
- Most significant at key support/resistance levels or after sharp moves.
How to Trade the Long-Legged Doji
- Wait for Market Resolution: Observe the next candle to determine direction.
- Entry Point: Trade breakouts above or below the Doji’s range.
- Stop-Loss: Set outside the opposite wick to avoid whipsaws.
- Targets: Use trendlines, support/resistance zones, or a defined risk-reward strategy.
What It Tells You
- Uncertainty among traders.
- Potential for high volatility after formation.
- Watch for volume spikes or external news catalysts.
FAQs: Long-Legged Doji Market Indecision
1. Is the Long-Legged Doji bullish or bearish?
Neither—it reflects indecision. The direction depends on what the next candle reveals.
2. How reliable is the Long-Legged Doji?
It’s more reliable when:
- Found at turning points in the market.
- Accompanied by high volume.
- Followed by a clear breakout candle.
3. Should I trade the Long-Legged Doji alone?
No. Always use it with confirmation—the next candle gives direction.
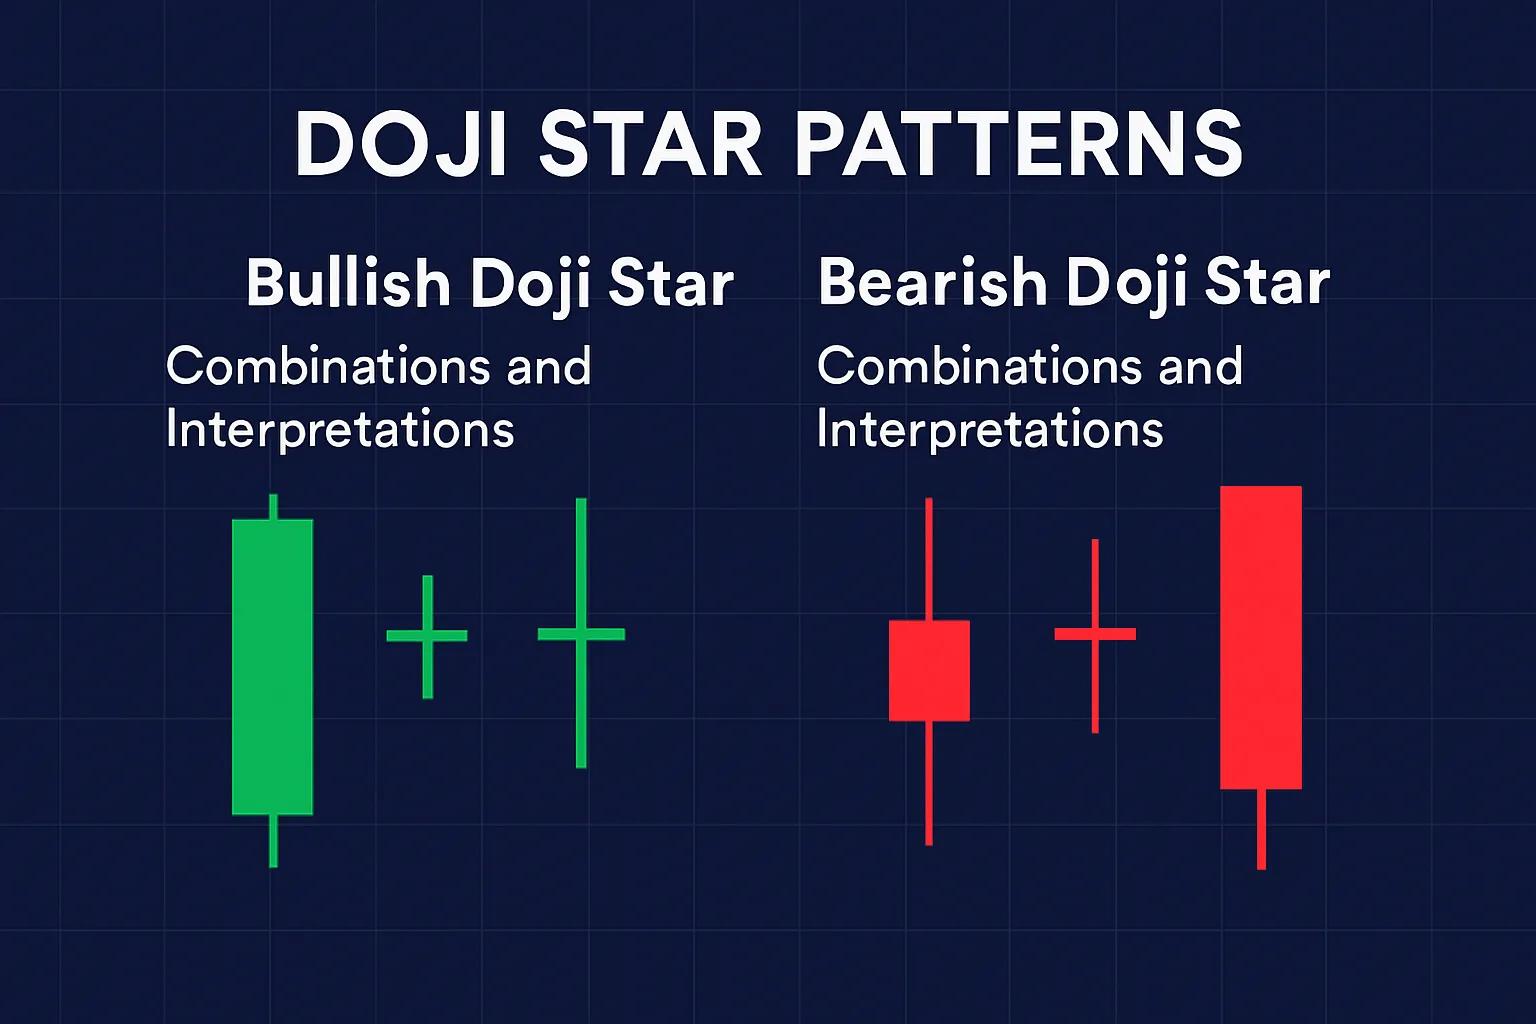
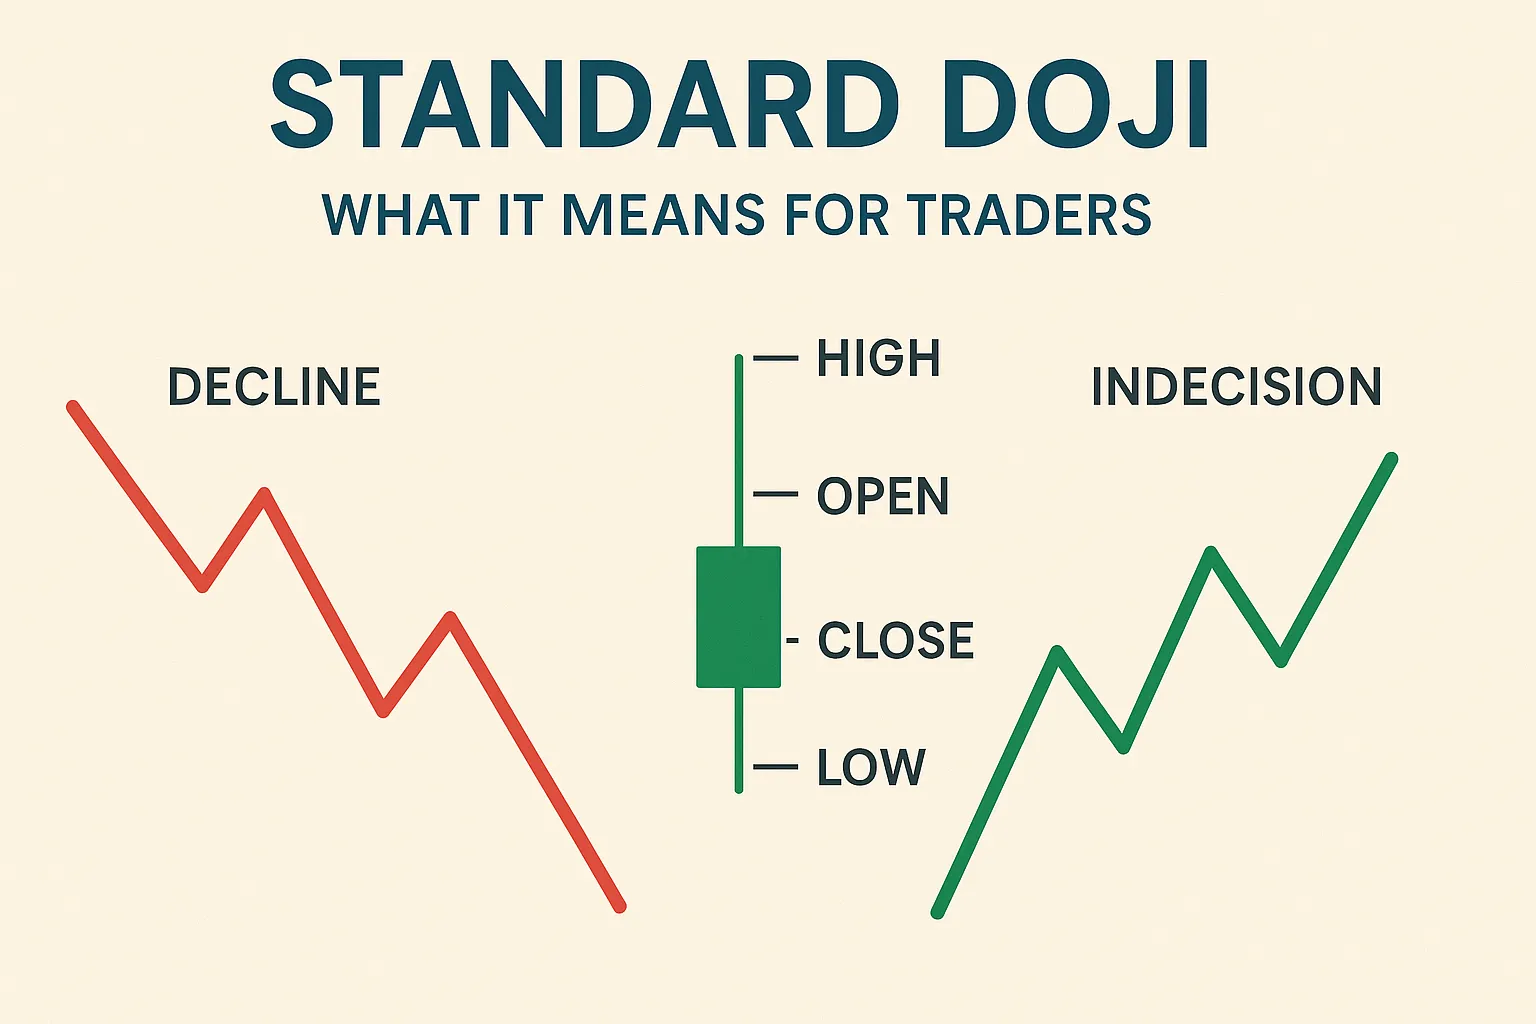
4. What’s the difference between Long-Legged Doji and Standard Doji?
- Long-Legged Doji: Has long wicks on both sides, showing strong but balanced moves.
- Standard Doji: Shorter wicks, indicating less volatility.
5. What time frames work best?
More effective on higher time frames like 1-hour, 4-hour, or daily charts.
6. Does this pattern indicate a breakout?
Often, yes. After indecision, the market tends to break out in one direction.
Conclusion
The Long-Legged Doji highlights periods of market hesitation, which often precede strong price movements. By carefully observing how the market reacts after this pattern, traders can position themselves for profitable trades once the indecision clears.