ntroduction
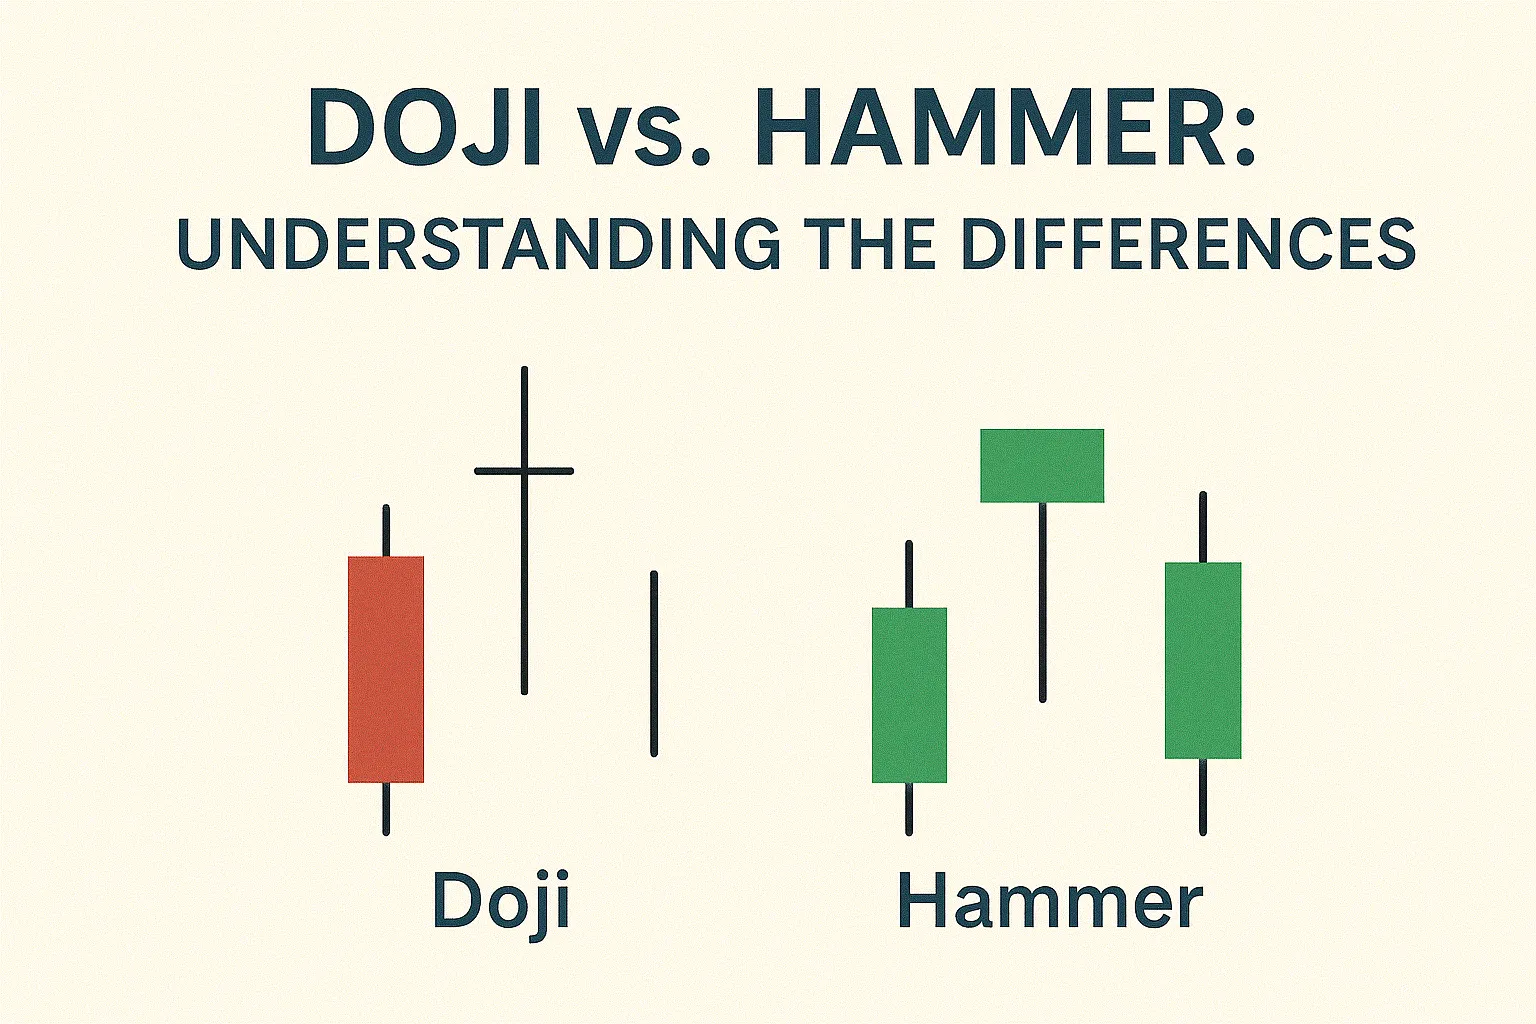
Both Doji and Hammer candlesticks are used to spot potential market reversals, but they have distinct formations and meanings. Misunderstanding the difference can lead to poor trading decisions. Let’s explore how these patterns differ and how to use them effectively.
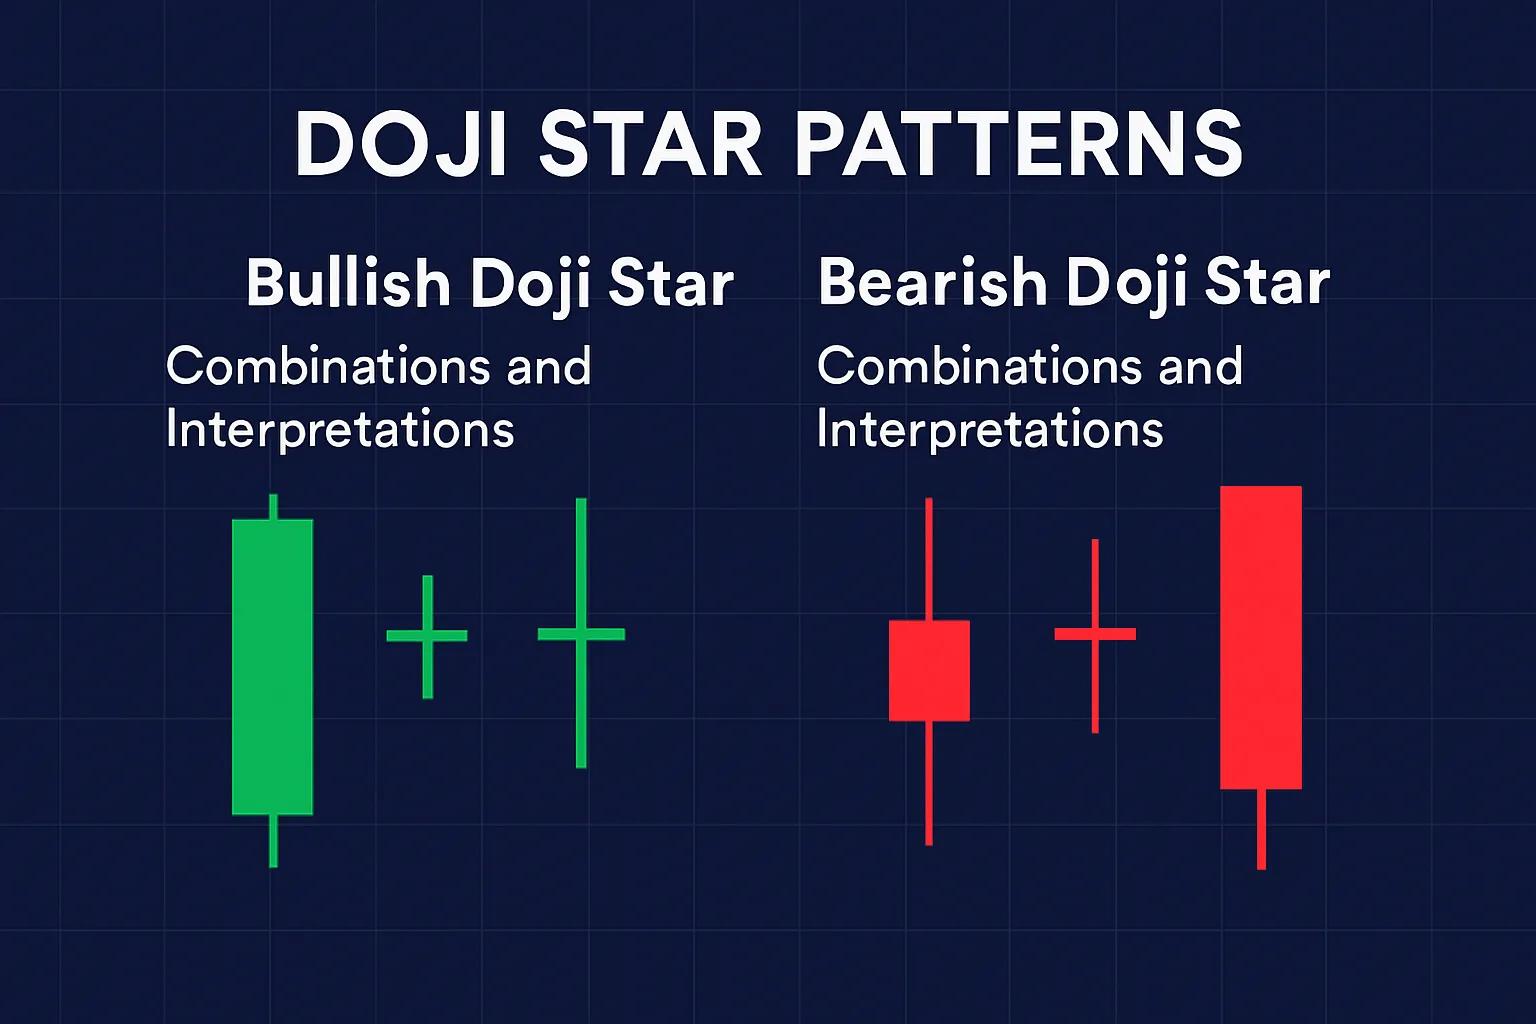
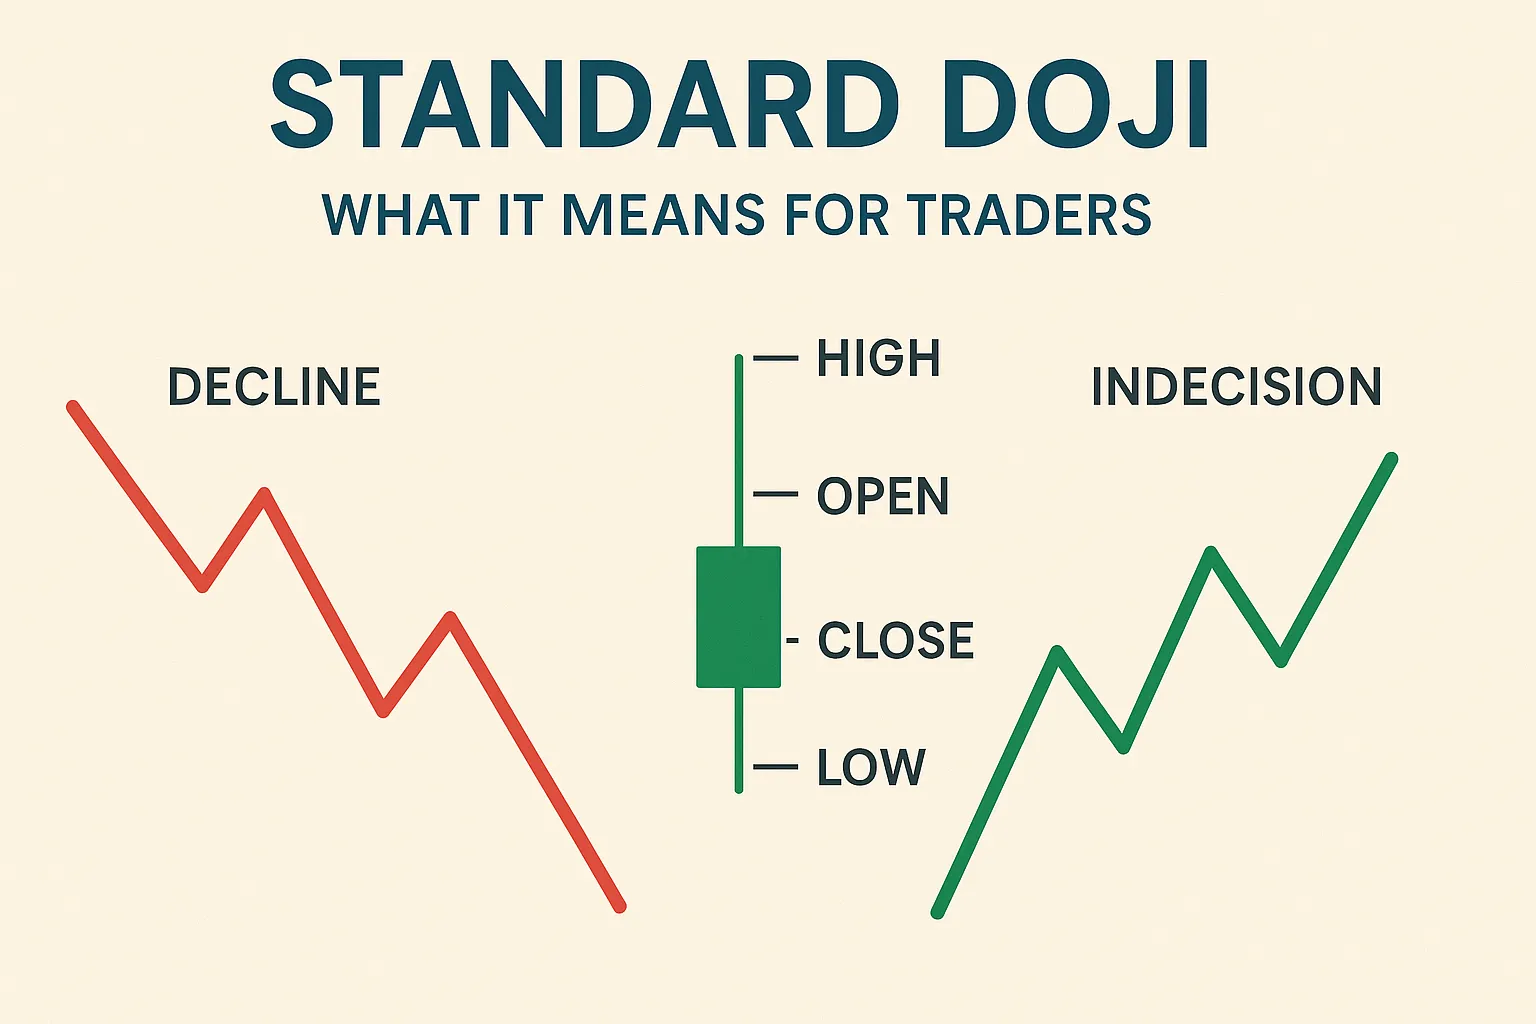
1. Doji Candlestick: Indecision in the Market
- Formation: Open and close prices are nearly the same, forming a small or no body.
- Shadows: May have long or short wicks on either side.
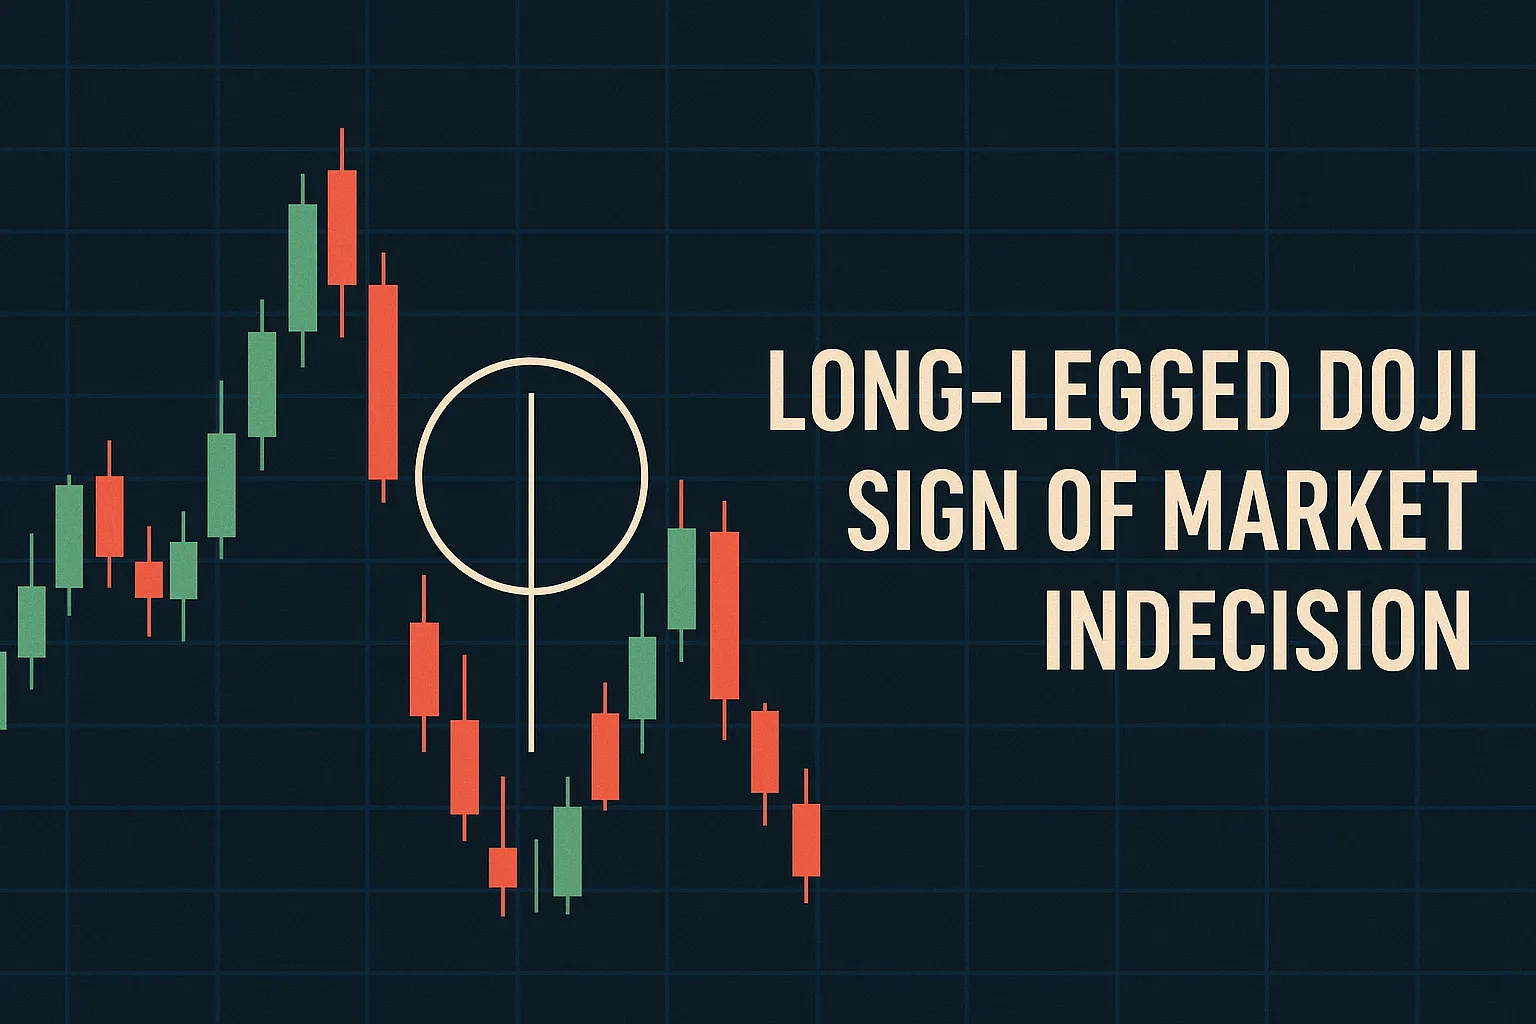
- Meaning: Reflects indecision—neither bulls nor bears are in control.
- Signal: Wait for confirmation before acting. Indicates potential pause or reversal.
2. Hammer Candlestick: Bullish Reversal Signal
- Formation: Small body near the top of the candle, with a long lower wick.
- Shadows: Minimal or no upper wick.
- Meaning: Sellers tried to push prices lower, but buyers regained control.
- Signal: Commonly seen at the bottom of a downtrend, signaling a potential bullish reversal.
Key Differences at a Glance
| Feature | Doji | Hammer |
|---|---|---|
| Body | Very small or none | Small, near top of the range |
| Wick | Varies, can be both sides | Long lower wick, little upper wick |
| Market Message | Indecision | Bullish reversal |
| Trend Location | Anywhere in trend | Bottom of downtrend |
How to Trade Them
- Doji: Use in trend analysis. Wait for the next candle to confirm direction.
- Hammer: Look for support levels and confirm with volume or indicators.
Conclusion
While both Doji and Hammer provide insights into market behavior, they serve different purposes. Understanding these patterns helps traders make smarter decisions and recognize key turning points in the market.