Introduction
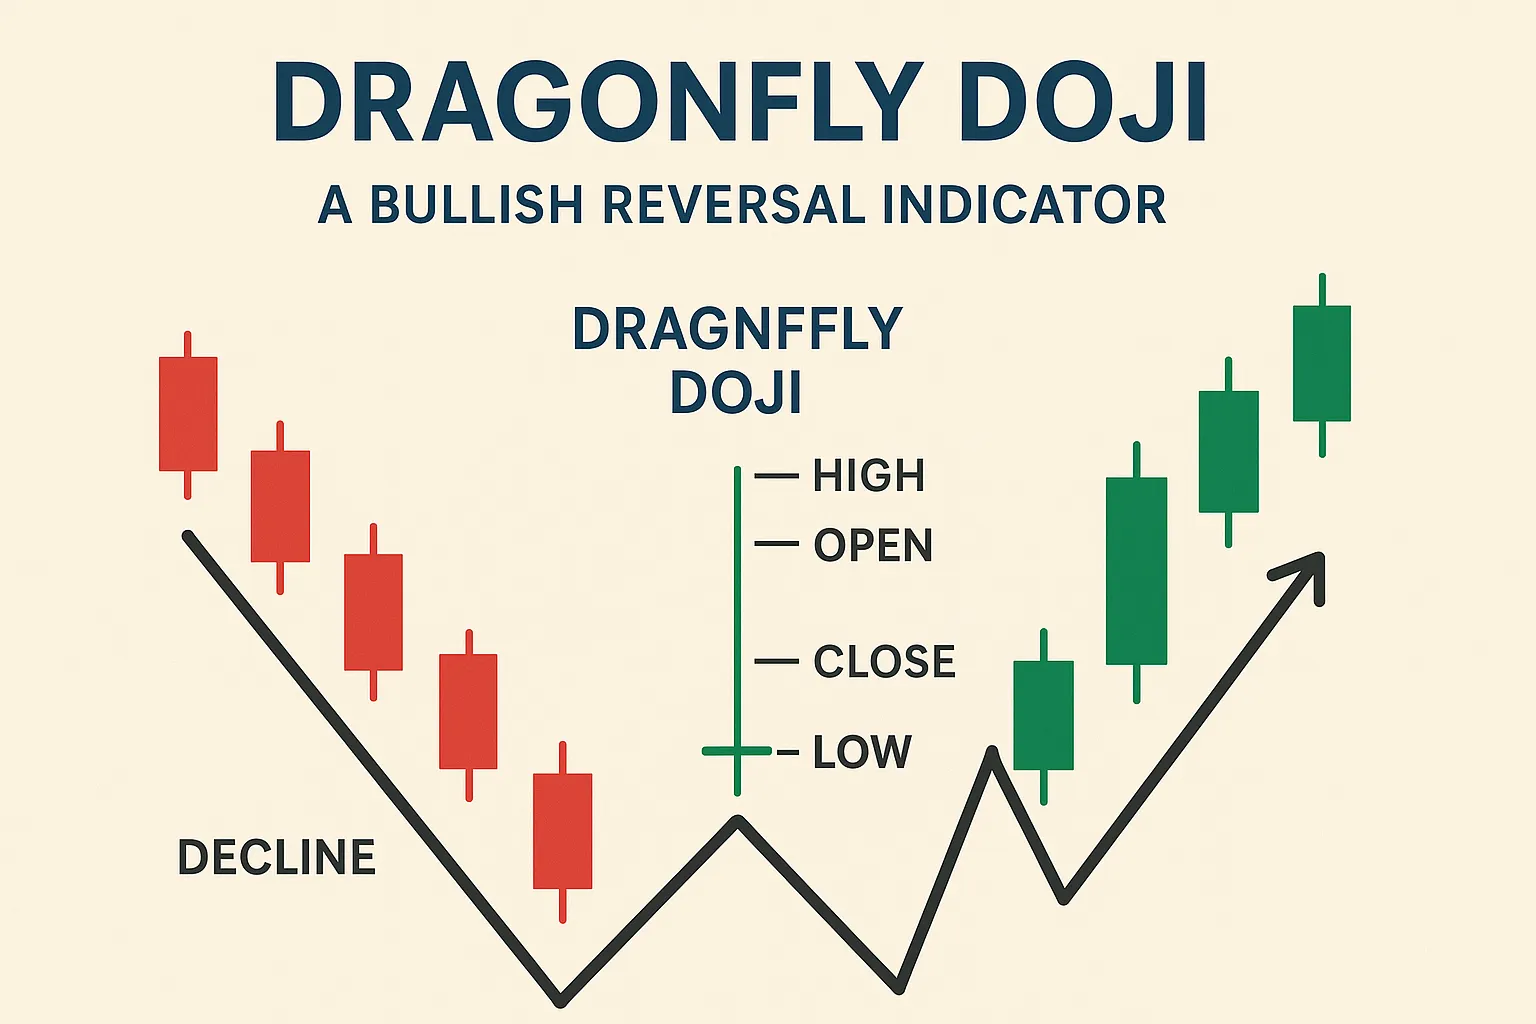
The Dragonfly Doji is a rare but powerful bullish reversal candlestick pattern that signals a shift from selling pressure to buying interest. Often appearing at the bottom of downtrends, this pattern alerts traders to possible upward price movements.
What is a Dragonfly Doji?
- Appearance: Long lower shadow, little to no upper shadow, with open and close at or near the high of the session.
- Psychology: Sellers dominated early, pushing prices lower, but buyers stepped in, pushing the price back to the open.
- Signal: Indicates bullish momentum may be starting.
Where and When to Spot It
- Commonly seen at support zones or after a sharp downtrend.
- Gains strength when followed by a bullish confirmation candle.
Trading the Dragonfly Doji: Step-by-Step
- Identify: Spot the Dragonfly Doji at the bottom of a downtrend or near support.
- Wait for Confirmation: A bullish candle closing above the Doji’s high confirms the reversal.
- Entry Point: Long trade above the high of the Dragonfly Doji.
- Stop-Loss: Place below the low of the Doji.
- Target: Look for resistance levels or aim for a 1:2 risk-reward ratio.
Why It Works
- Reflects seller exhaustion and buyer dominance.
- Signals market reversal potential, especially with volume increase.
- Useful in trend change detection.
FAQs: Dragonfly Doji Bullish Reversal
1. Is the Dragonfly Doji always bullish?
Yes, it is generally seen as a bullish reversal pattern, especially at the bottom of a downtrend.
2. How reliable is the Dragonfly Doji?
More reliable when:
- Found at support levels.
- Accompanied by high trading volume.
- Followed by a strong bullish candle.
3. Can I trade the Dragonfly Doji without confirmation?
No. It’s best to wait for the next candle to confirm the upward move before trading.
4. What’s the difference between Dragonfly Doji and Hammer?
- Dragonfly Doji: Open and close are the same, at the high.
- Hammer: Has a small body near the high, but open and close are not equal.
5. What time frames are best for Dragonfly Doji?
More reliable on higher time frames like 4-hour, daily, or weekly charts.
6. Can Dragonfly Doji form in an uptrend?
Yes, but it’s more significant when found at the bottom of a downtrend. In an uptrend, it may just signal a temporary pullback.
Conclusion
The Dragonfly Doji is a key candlestick pattern for spotting bullish reversals. By recognizing this signal at support levels and using proper confirmation, traders can enter high-probability trades and capitalize on market momentum shifts.