Introduction
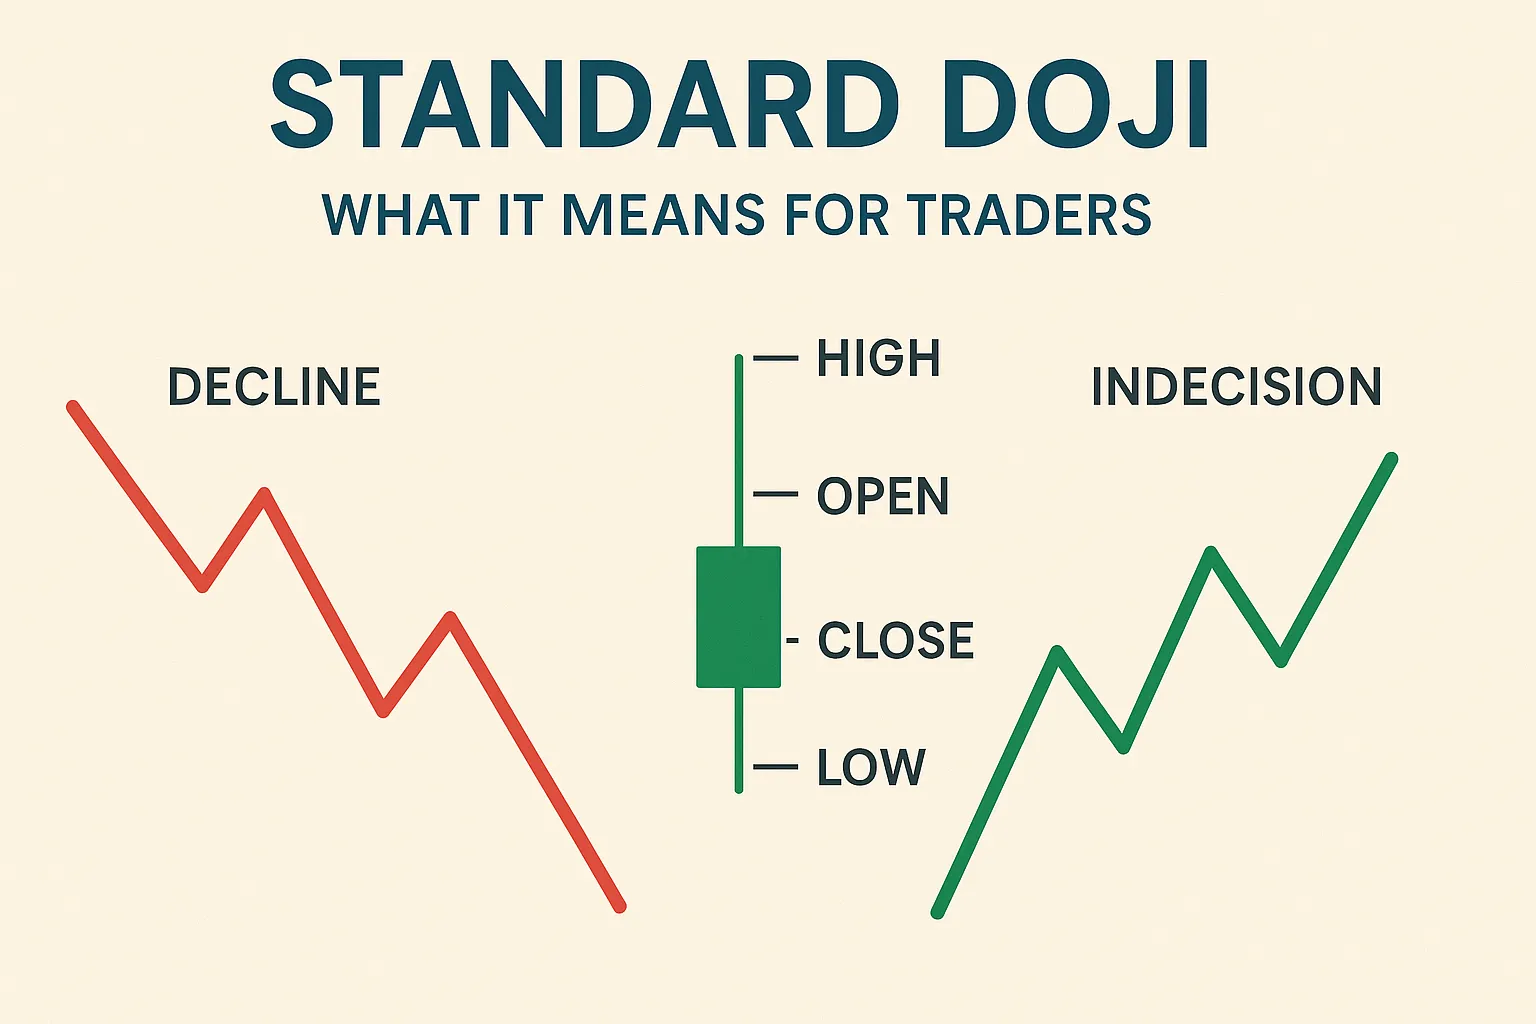
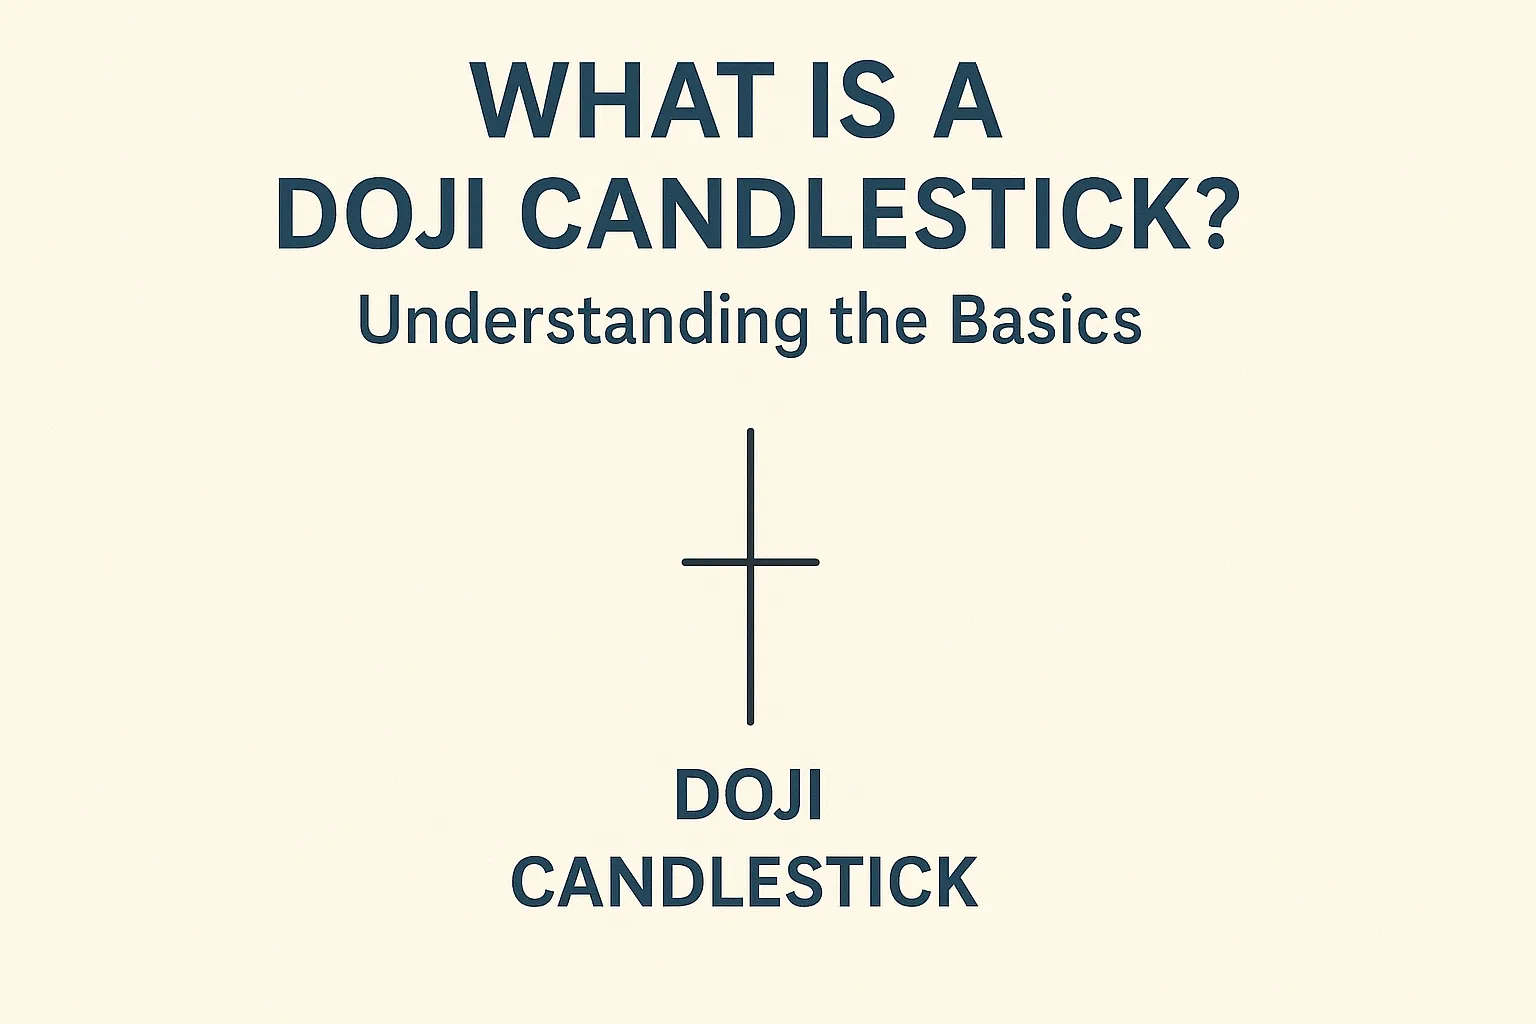
A Doji candlestick is a powerful signal in technical analysis, representing market indecision. It forms when the opening and closing prices are nearly identical, creating a neutral-looking candle. Understanding the Doji is essential for traders looking to spot potential reversals or pauses in market trends.
How is a Doji Candlestick Formed?
- Open = Close (or nearly equal).
- Small or no real body, with upper and/or lower wicks.
- Occurs when buyers and sellers are balanced.
What Does a Doji Signal?
- Indecision: Neither bulls nor bears dominate.
- Potential Reversal: Especially after strong trends.
- Pause in Trend: The market may be taking a breather.
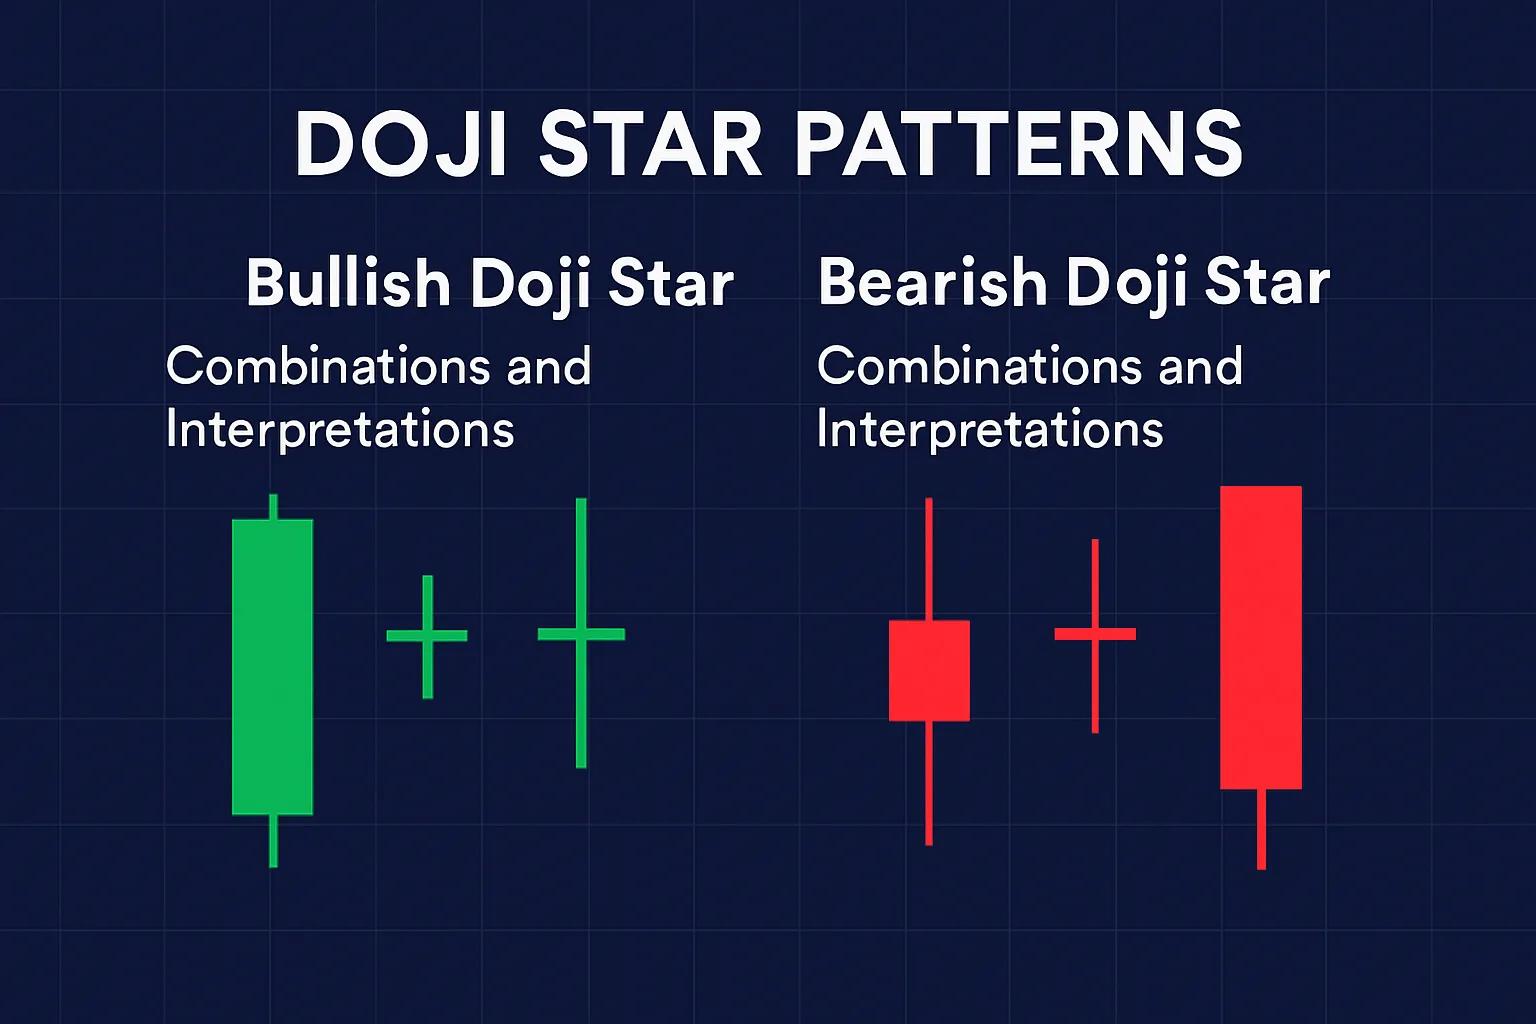
Types of Doji Candlesticks
- Standard Doji: Equal open and close with small wicks.
- Gravestone Doji: Long upper wick, no lower wick.
- Dragonfly Doji: Long lower wick, no upper wick.
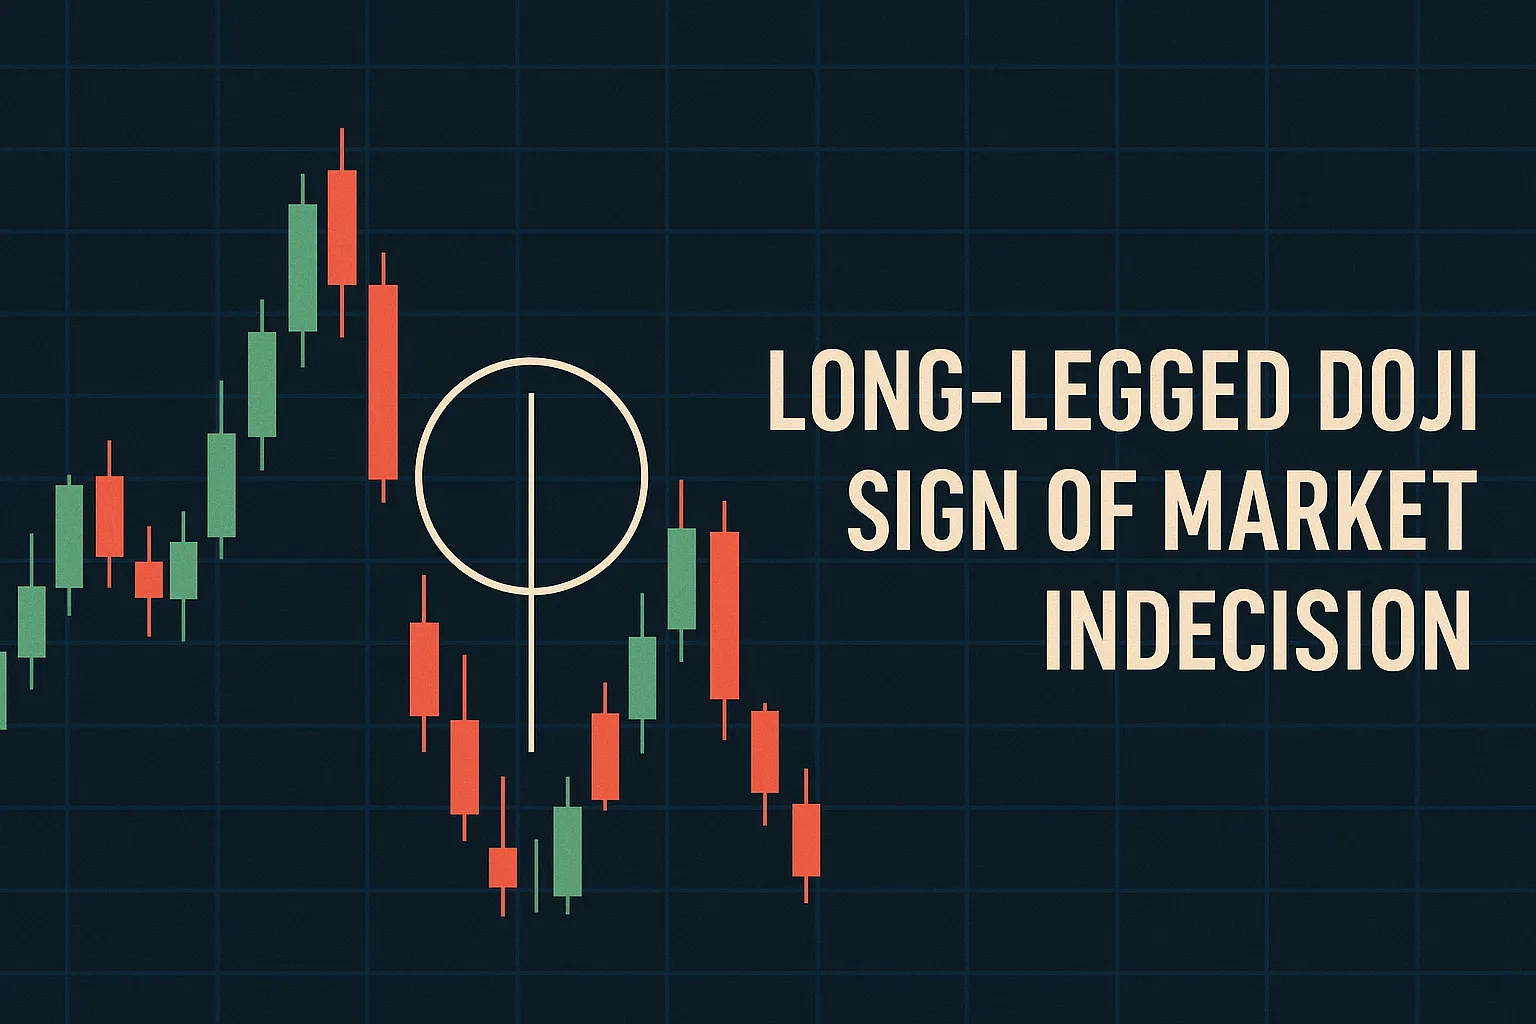
- Long-Legged Doji: Long wicks on both sides.
Where Dojis Commonly Appear
- At key support or resistance zones.
- During high volatility periods.
- After strong price moves, signaling caution.
How to Trade a Doji
- Wait for Confirmation: The next candle shows direction.
- Use in Trends: More effective at the end of trends.
- Combine with Indicators: RSI, MACD, or volume analysis.
Conclusion
The Doji candlestick is a simple yet insightful pattern that highlights market hesitation. While it doesn’t predict future price moves alone, it provides valuable context for traders who look for confirmation and use it as part of a broader strategy.